Visualizing Network Topology Using Netdisco
Tags:
#networking
#Netdisco
Warning
This blog post describes a deployment that is not optimal for production. Use it only as part of development. The deployment will be based on containers. It is possible to install binaries on an operating system.
Warning
Not all vendors are supported by Netdisco.
Introduction To Netdisco
Netdisco is a web-based management network tool. It allows users to view and manage their network equipment.
Gathering Information
Netdisco uses SNMP, CLI or device-specific APIs to authenticate with equipment and collect information
Some of the gathered information includes:
- MAC addresses, IP addresses, and SSIDs.
- VLANs
- Equipment inventory, based on the model, hardware, software, and operating system.
- Neighbors
If allowed, Netdisco can modify the discovered configuration.
Visualizing Neighbors
One of the main benefits of Netdisco is the ability to visualize neighbors.
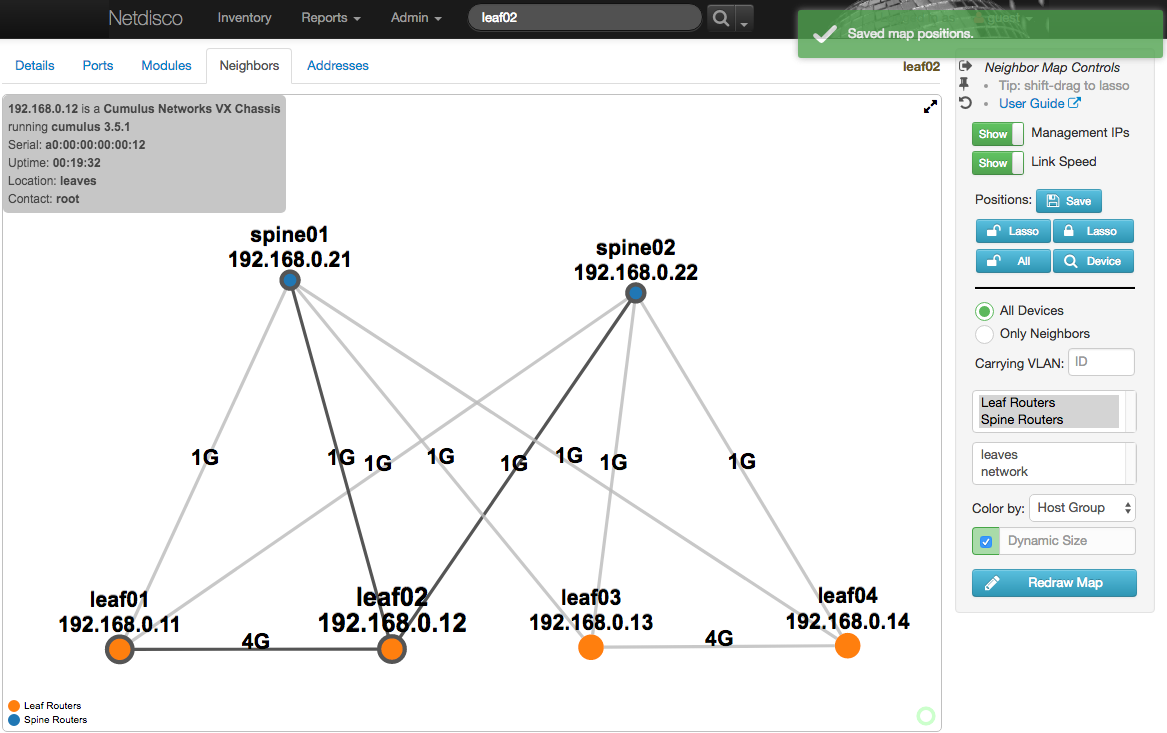 This greatly helps to understand the networking stack and assists with debugging connectivity issues.
Reports
Netdisco can generate reports based on gathered information.
Some of the built-in reports include:
- VLAN inventory
- IP inventory
- Port utilization
Users can create custom reports using SQL queries from gathered information stored in the database.
How Netdisco Works
Netdisco is an application written in Perl.
Application Components
Netdisco is built from several components:
- Backend agent (
netdisco-backend) - responsible for gathering and updating information and storing it in a database. - Web (
netdisco-web) - frontend component to display a web user interface to interact with the backend agent. - CLI (
netdisco-do) - utility to interact with the backend from the command line.
Information gathered is stored in a PostgreSQL database.
Application Jobs
The backend agent has four principal jobs it can do:
- Discover - Gather information about a Device, including interfaces, VLANs, PoE status, and chassis components (modules). Also learns about potential new Devices via neighbor protocols and adds jobs for their discovery to the queue.
- Arpnip - Gather MAC to IP mappings from known Devices reporting layer 3 capability.
- Macscuk - Gather MAC to port mappings from known Devices reporting Layer 2 capability. Wireless client information is also gathered from Devices supporting the 802.11 MIBs.
- NBTstat - Poll a Node to obtain its NetBIOS name.
Configuration
Netdisco uses environment variables for configuring and debugging the application itself (file paths, DB information, tracing, and more).
YAML config is used to configure the application behavior and functionality.
Default configuration shipped with the application config.yml.
Getting Started
Installation
There are several ways to install Netdisco.
Installing Binaries
This method will not be covered in this blog post. Please refer to the documentation hosted on CPAN.
Using Official Docker Images
Netdisco community provides official docker images.
Using All-In-One Container For Development Purposes
I have created an all-in-one container that can be used for development purposes.
Discovering Devices
After installing and configuring an instance of Netdisco, we can start discovering our devices.
Via Web Interface
Logging into the web interface, we are greeted with a simple interface:
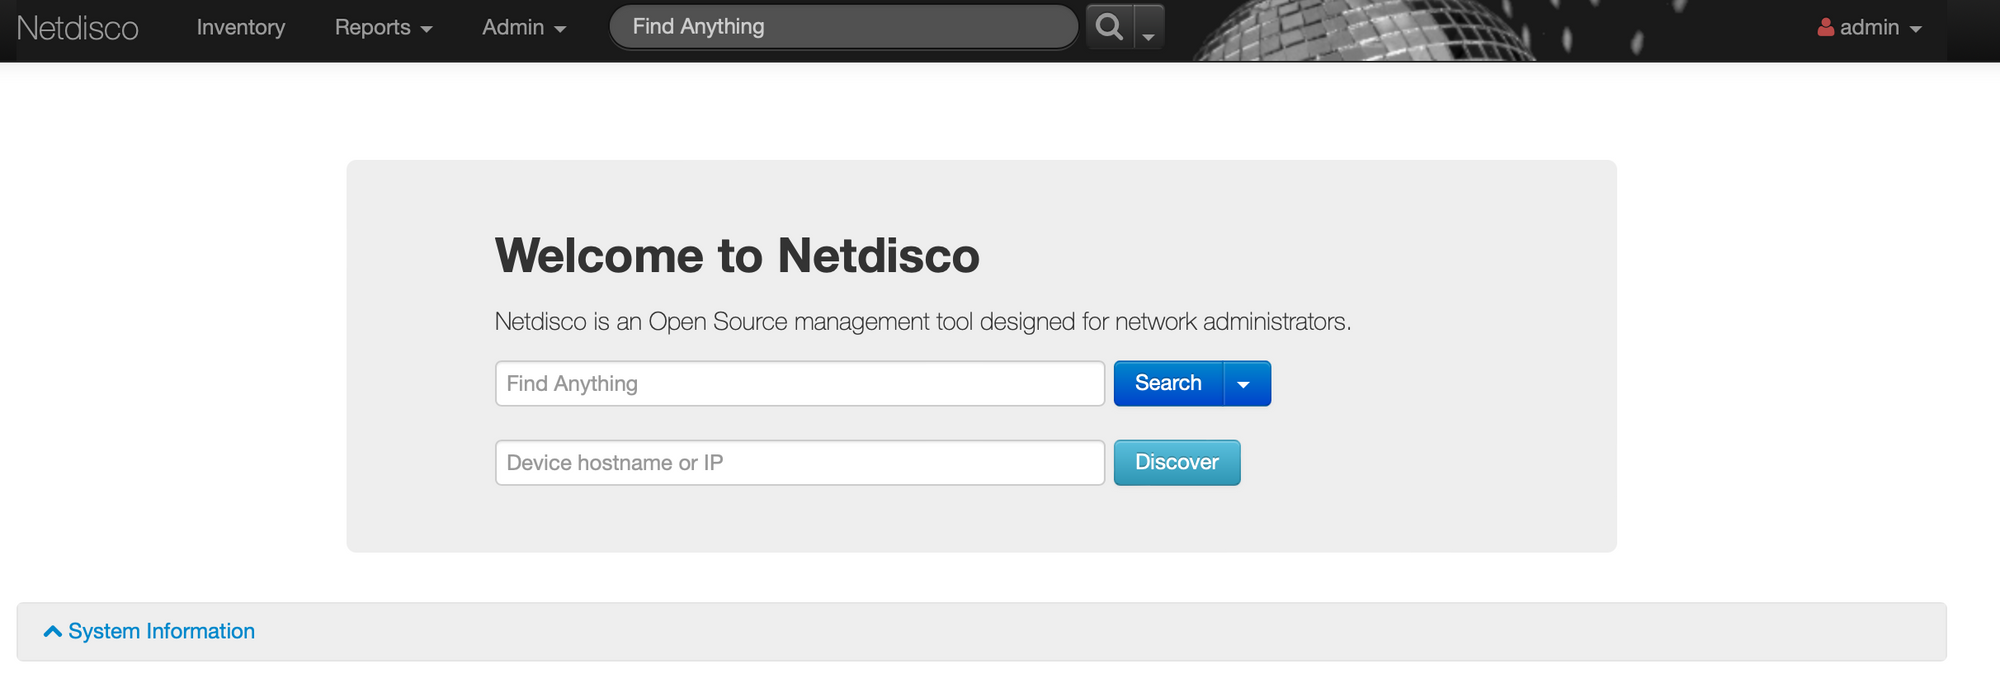
To initiate discovery, fill in Device hostname or IP with the DNS/IP of the device and press search. After pressing search you will be redirected to the Job Queue page.
(Job queue page is accessible manually Admin -> Job Queue)

A discovery job will start on the provided node.

If the node is connected to neighbors and is discoverable using LLDP/CDP, Netdisco will automatically attempt to discover them.

Discovered nodes are now accessible using the search bar at the top of the page.
Clicking on a node redirects to a page containing gathered information of the node.
Via CLI
To initiate device discovery:
netdisco-do discover -d <DNS_OR_IP>
The command will wait until timeout or completion:
[22229] 2022-11-28 17:59:08  info App::Netdisco version 2.058003 loaded.
[22229] 2022-11-28 17:59:08  info discover: [<DNS_OR_IP>] started at Mon Nov 28 17:59:08 2022
[22229] 2022-11-28 17:59:41  info discover: finished at Mon Nov 28 17:59:41 2022
[22229] 2022-11-28 17:59:41  info discover: status done: Ended discover for <DNS_OR_IP>
Collected data can be viewed (available fields):
netdisco-do show -d <DNS_OR_IP> -e c_platform
# Output
[22427] 2022-11-28 18:55:02  info App::Netdisco version 2.058003 loaded.
[22427] 2022-11-28 18:55:03  info show: [10.46.93.1]/c_platform started at Mon Nov 28 18:55:03 2022
{
    11623.5   "cisco WS-C3750G-24T",
    11624.1   "DS-C9148-32P-K9",
    11624.6   "cisco WS-C3750G-24T"
}
[22427] 2022-11-28 18:55:04  info show: finished at Mon Nov 28 18:55:04 2022
[22427] 2022-11-28 18:55:04  info show: status done: Showed c_platform response from <DNS_OR_IP>
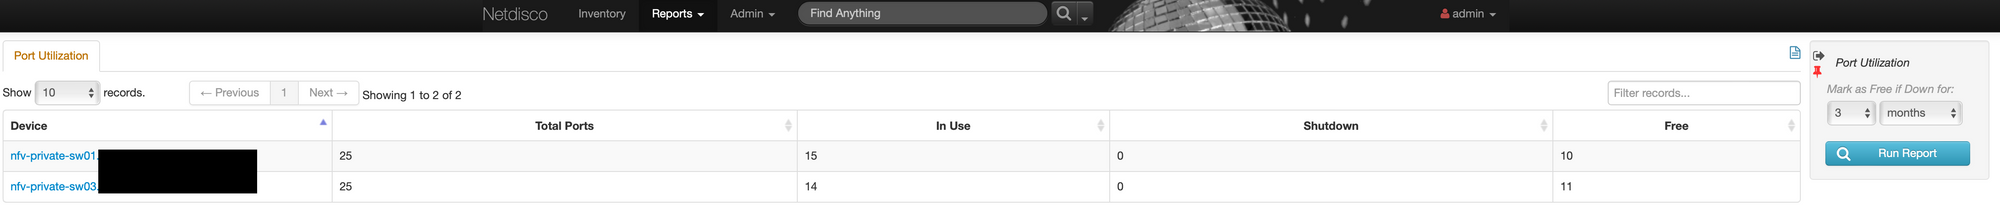
Viewing Reports
Based on the gathered information, Netdisco offers built-in reports.
One of the basic reports is the Port utilization (Reports -> Port Utilization):
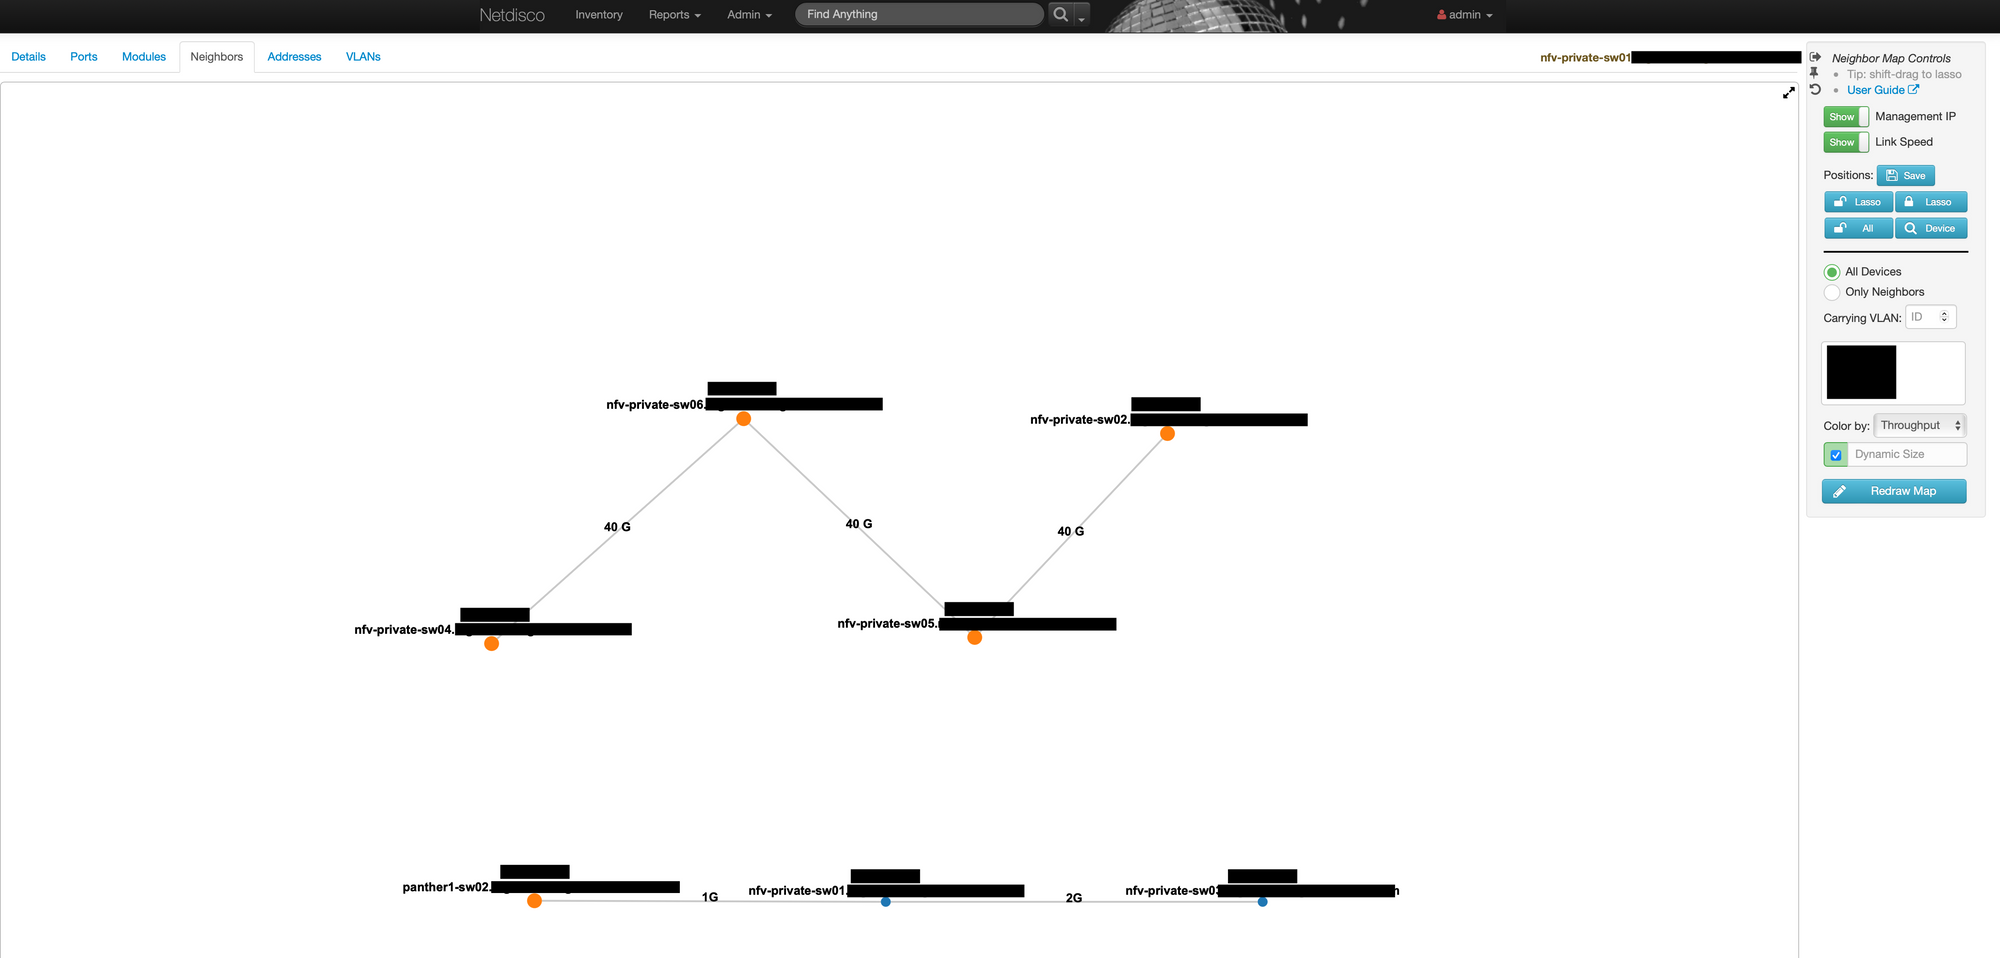
Drawing Network Topology
After discovering devices, we can draw the network topology.
Search for the required node, click on Neighbors, and filter accordingly.
Summary
This blog post covered a small part of Netdisco’s reporting and capabilities.
For more information, please visit Netdisco’s homepage or git repository.